SumobotThis project is a project in which we are making robots that will compete like sumo wrestlers to get each other out of the stage. The robots will be completely CPU commanded, so we will have no part in controlling the robot other than programming it. The prototypes we made were made out of lego bricks. Our final project can be made out of things other than legos such as metal and wood. The robot my team is making is made out of a cardboard kind of material. I am the programmer, so I'm programming the robot to detect where the edge of the ring is, to charge forward to push the other robots out of the ring, and to run away if a robot tries to attack it from the back.
|
 |
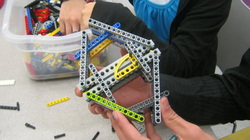 |
Chassis 1The top view of our chassis, made out of lego bricks. We used triangles and compression so that when it was dropped or thrown, it would not break. It is very strong.
|
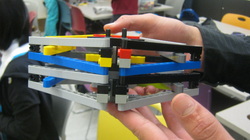
Chassis 2Side view of our Chassis. Our second chassis didn't change from the first chassis, but it will probably change and be revised in the future, wen we add in motors and the CPU.
|
 |
 |
Chassis 3/The Final Product [sort of]
This is our final chassis and the one we're going to use to battle against other robots. It's made out of a more cardboard like material instead of the lego bricks. I honestly think that the lego bricks had worked better but I'm trusting my teammates that this chassis will work just as well.
It turns out this one was overweight by about 200 grams. We're going to have to rebuild it. |
 Search Strategy
Our search strategy uses a far ranged infrared sensor. The robot will spin in a circle so that the sensor can find the other robots on the battle field. The sensor tells the robot if there is something there or not, and if there is, it should charge in for attack.
|
|


Greek Inventions Project
The Greek Inventions Project is a project in which we chose an ancient Greek invention to make a scale model of. The Greek also contributed not only ideas but actual machines and
inventions used today. My group was assigned to remake a model of the
crane, a machine that was used to lift heavy items
Title page/Info on the Crane:
Title page/Info on the Crane:
| Description of Crane |
Drawings and Presentation Board. It was important to have these for we would keep referring back to them as we worked on constructing our crane. We needed the measurements so that the model wouldn't be all wonky and weirdly cut, and uneven. The purpose of revising these drawings were to make them better and more suitable to how we were to build the crane with wood or cardboard.
|
|


|
|
The purpose of having the Google Sketch up of the crane was that we could see it in 3D rather than just flat drawings. We could change the camera views to see how it would look from an angle instead of just the side.
This Sketch-Up was made by Eden Ambriz. |
 Prototype of the Crane. It's made out of cardboard, string, and a pulley. |
Prototype. A problem we encountered was making the legs at that specific angle. We had to measure out the angle with a protractor so that it wouldn't be uneven. Also, another dilemma we encountered was how to make it stand, for all the weight was leaning forward. We added the suspension ropes, after looking at a picture of an ancient Greek crane and seeing that we could copy it. It worked well and supported our crane. The prototype was actually quite close to the drawings. The importance of making the prototype was that so we could test our ideas and make sure we can make a functioning model with the blueprints we had drawn out
|
 Model of the crane. It's made out of wood, a metal stick for the bar, string and pulleys. |
Final Model. We encountered almost the same problems and the crane itself ended up smaller than we planned it to be in width. We had to make changes from cardboard, which was more flexible, to wood, which was stiff and couldn't be spread so far unless it had the right angles cut into it, which was quite difficult. In the end we managed to build a successful model that worked. From this, I learned how to use powertools and different kinds of saws for different kinds of cuts. Also, I realized you needed exact cuts so that the model would be accurate. I would be sure to keep these in mind next time I make a model.
|
Greek Contributions
The Greek contributed many things to our world that we still put to use in modern society. In class, each group was given a topic to study and teach the rest of the class about. For example, the topic I studied were what the Milesians contributed to us. The Milesians were considered among the first contributions that the Greek gave us and were considered the first to do real science. They believed that the world was not ruled by gods, rather by some other force.
| presentation1.pptx |
My World in Motion: Tracking Velocity
This is the Math and Science part of the "My World in Motion" project. This is when we take a video of an activity of our body in motion and then we track our motion in Logger Pro. With that, we can calculate our velocity and our acceleration.
For me, I swung a sword to track the motion of how fast my hand moves. Here is the video of my body in motion:
For me, I swung a sword to track the motion of how fast my hand moves. Here is the video of my body in motion:
|
|
 Picture/Still Frame |
Here are the graphs of my position vs. time, my velocity vs. time, and my acceleration vs. time, as well as my motion map.
|
|


Here are the first drafts of my graphs. These were drafts because I didn't zero out the time. The acceleration graph looked the same as my velocity graph and I managed to fix that as well. The Motion map was inaccurate to the actual graph and the acceleration vectors were drawn terribly wrong.
|
|


I understand now that things speed up according to gravity and those things are influenced by other things to stop their motion, thus the law of inertia. Friction plays a big role in velocity and accelertion. In my video, I was the thing that influenced my sword to stop moving near the end of my motion.
The relationship between the graphs, the motion maps, and the written descriptions are that they are all essentially describe the same motion but in different ways. The x vs t graph shows the actual motion of my swing, the v vs t graph shows how fast I go, and a vs t shows how my arm speeds up as I swing. The motion map describes all three and the motion in general, how fast the motion is and the acceleration. The written descriptions tell you what's happening in each graph.
The relationship between the graphs, the motion maps, and the written descriptions are that they are all essentially describe the same motion but in different ways. The x vs t graph shows the actual motion of my swing, the v vs t graph shows how fast I go, and a vs t shows how my arm speeds up as I swing. The motion map describes all three and the motion in general, how fast the motion is and the acceleration. The written descriptions tell you what's happening in each graph.
